How do you even web dev without node? A quick introduction to test-driven web development using just the browser
Node is all there is, right?
It is the beginning and the end of all of web development.
We use it to install our tools, even the ones not made in node. We use it to run all of our tools – you use your shell to call npm, which loads node, which then calls the shell with what you intended to run. We use it to manage our dependencies. We use it to run tools to bundle our code, even though those bundlers are almost never implemented in node themselves, and even though the project in question might not need a bundler.
And we use it to run our tests.
Occasionally, somebody uses it to write server-side software, but many of us are – for good reasons – often using something else for the server.
The weight we have hanging off a single runtime is enormous and it isn’t surprising that this pressure translates into complexity.
Node is all there is and it’s become one of the biggest sources of complexity in non-node projects.
You know that feeling of dread: coming back to a PHP, Ruby, or Python web project after a while and crossing your fingers – hoping that the fragile JS setup hasn’t broken somehow in the meantime.
—Oh, no. Why do we have all of these security alerts? All we’re using the JS for is to validate some forms!
—Why doesn’t the testing framework work any more? Dot releases should be safe, right?
—Crap! The new version of the form-handling library has breaking updates. I don’t have time to deal with this.
—Damn. There’s a new version of Typescript out. Now I need to figure out if upgrading would break something.
Most of us have stories and none of them are of the happy “they all lived happily ever after” kind.
It’s a pain, but node is just a hard requirement for modern web development, right?
Right?
Well, maybe not.
Web servers and browsers are amazing tools in their own right #
Wouldn’t it be nice if you could do modern web dev with just the tools of your language of choice and the web browsers you already have set up?
Wouldn’t it be nice if you could take node completely out of the equation for web projects that are using PHP, Ruby, or your preferred server-side platform?
Wouldn’t it be nice if setting up a new developer on a project only had to worry about the runtimes and libraries needed for the core project, not the asset-building?
This is absolutely possible with a buildless JS setup. ES modules, HTTP imports, and import maps work extremely well for the kind of mid-sized JavaScript projects required for many PHP or Ruby web services.
It’s even possible with many setups that do require bundling as tools like esbuild work both on their own, without wrappers, and with alternative runtimes that are simpler to manage, like deno.
That still leaves us with a problem. Even if you’re skipping bundling or have that sorted with a simpler tool, you’re still left with a lot of tooling that’s implemented in node. An important one is the test-runner.
But there’s a way out.
Test in the browser with Mocha #
Sometimes you can have the best of both worlds: the simplicity of an HTML-based test-runner and continuous integration with coverage checks.
Mocha, the venerable JS testing framework that’s been around for years and is still popular today, still works perfectly well with an HTML test runner in a standard web browser. But, in the intervening years, browsers have added two new capabilities that turn the venerable HTML-based test runner into a tool that’s more not less capable than most people’s node setups.
But more about that later.
I’ve put together a minimalistic setup that demonstrates how you could set up an HTML test runner with continuous integration and coverage: no-node-mocha
It uses deno to render the template, but any programming language that lets you serve the files from the current working directory and render an HTML template will do the job. For smaller projects you could even just edit the HTML yourself to add the test files.
The Mocha web page even has a short guide to show you how.
I made a few small changes that I think help make the entire process more usable. The first convenience is using EventSource and server-sent-events to reload the test page whenever a js file is changed in the current working directory.
But that’s a nice-to-have not a must-have and in modern web development Continuous Integration (CI) and code coverage are Must Haves™.
Here’s how the body of the test page looks like in my version (with the EventSource bits omitted).
<body>
  <div id="mocha"></div>
  <script src="/.test/chai.js"></script>
  <script src="/.test/mocha.js"></script>
  <script type="module">
    mocha.setup({
      ui: "${mochaInterface}",
      timeout: "${mochaTimeout}",
    });
    mocha.checkLeaks();
    window.addEventListener("load", function () {
      mocha.run(function (failures) {
        window._testResults = {
          done: true,
          failures,
          succeeded: failures ? false : true,
        };
      });
    });
  </script>
  <!-- These scripts are the test scripts -->
  ${testFiles}
</body>
The biggest changes:
- I’m using a local prebuilt copy of mocha and chai and, in the HTML head, I also use a local copy of the mocha CSS file.
- I made the
ui(bddortdd) andtimeoutoptions for mocha configurable. mocha.runis passed a callback that gets called when the tests are done, and I assign the results to a global. This is to make it easy for the CI automation to tell when the tests are done.- I have
denodiscover the test scripts automatically using globbing. Each test script path is then rendered to an HTML script element that looks something like this<script type="module" src="${path}"></script>. These elements are then included in the final template using thetestFilesvariable.
Making sure the browsers are correctly set up #
One other important note about using an HTML test file in preinstalled browsers is you need to make sure your existing browser setup isn’t interfering with your tests.
The simplest way to ensure that is to launch your test browser with a fresh profile. This is relatively straightforward with Firefox and Chrome as they launch with fresh profiles if they are set to use an empty data directory. (These things are rarely actually straightforward, but this is closer than many other things in coding.)
I use a shell script to launch Chrome and the important bit looks like this (you can see a full example in the no-node-mocha repository).
# This uses mktemp to create an empty temporary directory
# Because this DATA_DIR is empty the profile will be a new one
DATA_DIR="$(mktemp -d -t 'chrome-unsafe_data_dir.XXXXXXXXXX')"
"${CHROME}" \
        --ignore-certificate-errors \
        --no-default-browser-check \
        --no-first-run \
        --non-secure \
        --user-data-dir="${DATA_DIR}" \
        https://localhost:8888/ >/dev/null 2>&1 &!
CHROME is whatever the path is to a binary that can launch Chrome from the command-line (macOS users will probably have to use something like open -a "Google Chrome" --args instead of a path to a binary).
The core of the Firefox script:
# This uses mktemp to create an empty temporary directory
# Because this DATA_DIR is empty the profile will be a new one
DATA_DIR="$(mktemp -d -t 'firefox-unsafe_data_dir.XXXXXXXXXX')"
"${FIREFOX}" -profile $DATA_DIR -no-remote -new-instance \
        https://localhost:8888/ >/dev/null 2>&1 &!
Coverage #
Code coverage tools are a revelation when you first begin to use them. Even if you aren’t trying for 100% code coverage, knowing exactly which code paths are being run by your test suite means you’re no longer working blind. Instead of fumbling around in the dark, you are working under the heat of floodlights.
Chrome comes with this feature built into its developer tools. No additional tools necessary.
For monitoring coverage during development we use Chrome’s Developer Tools. You can open the coverage panel by going to the three dot menu in the developer tools → “More tools” → “Coverage”.
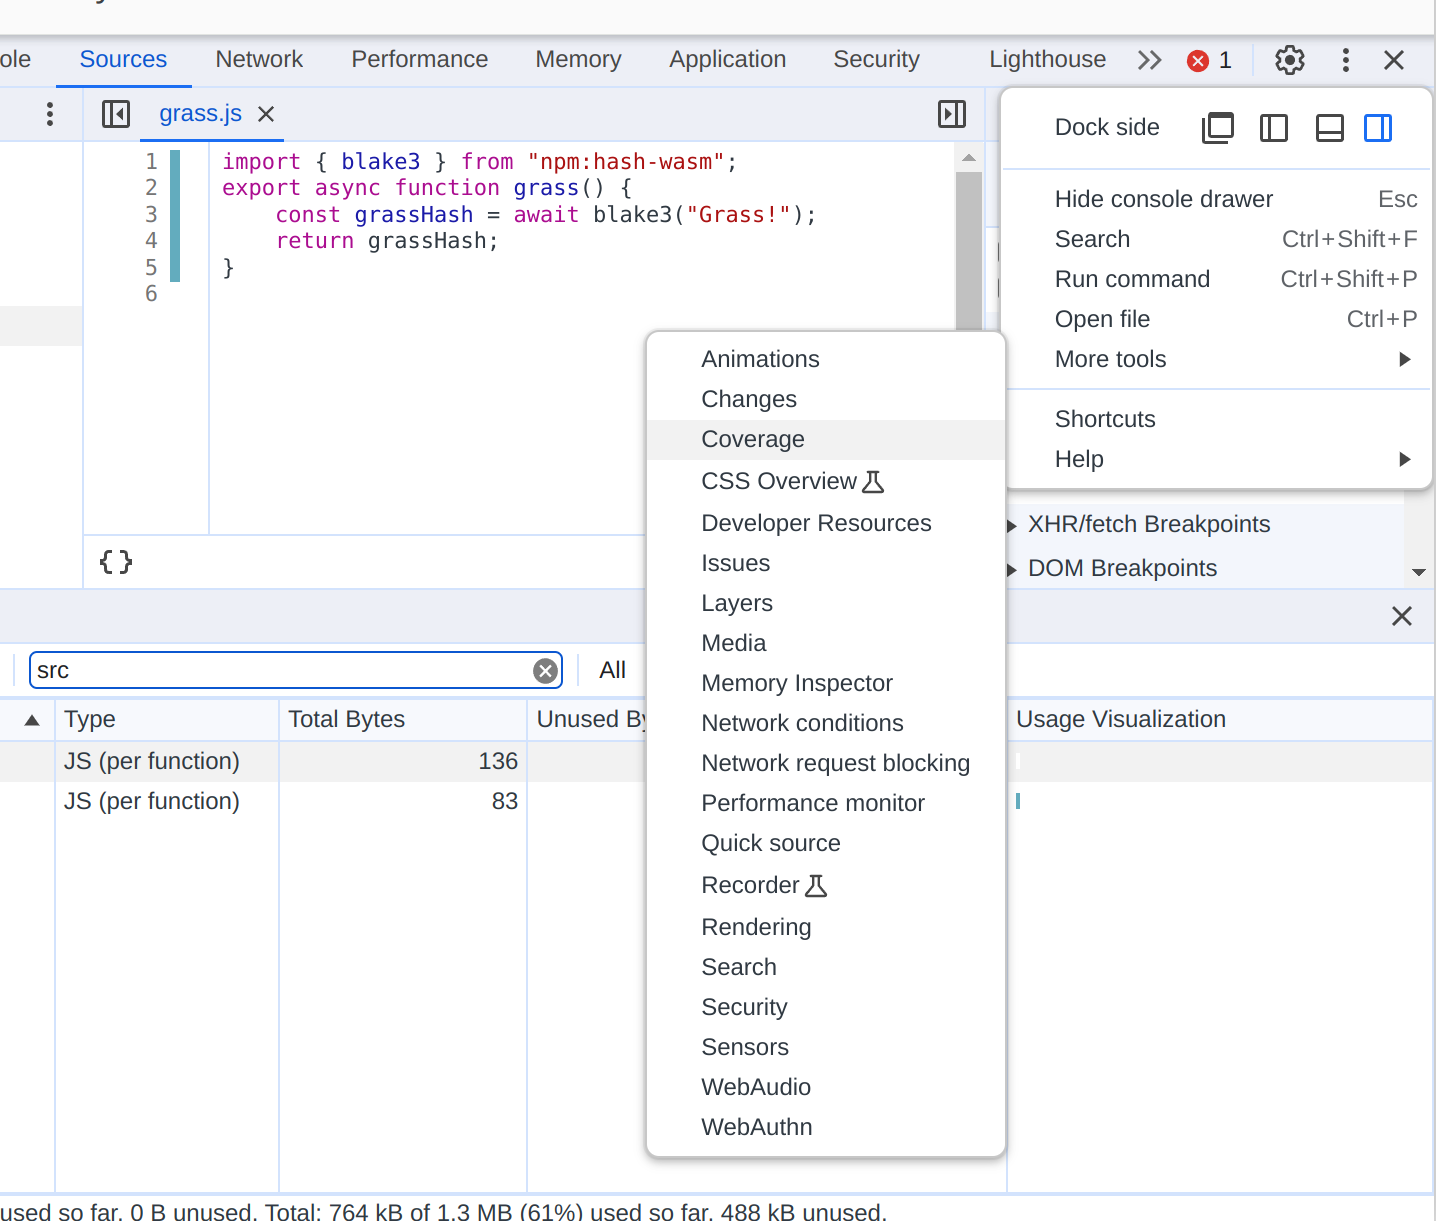
Once the coverage panel is open you use the URL filter text box to filter the coverage report to just the directory where you have your source files. This way you aren’t getting spurious coverage reports for dependencies or the test framework.
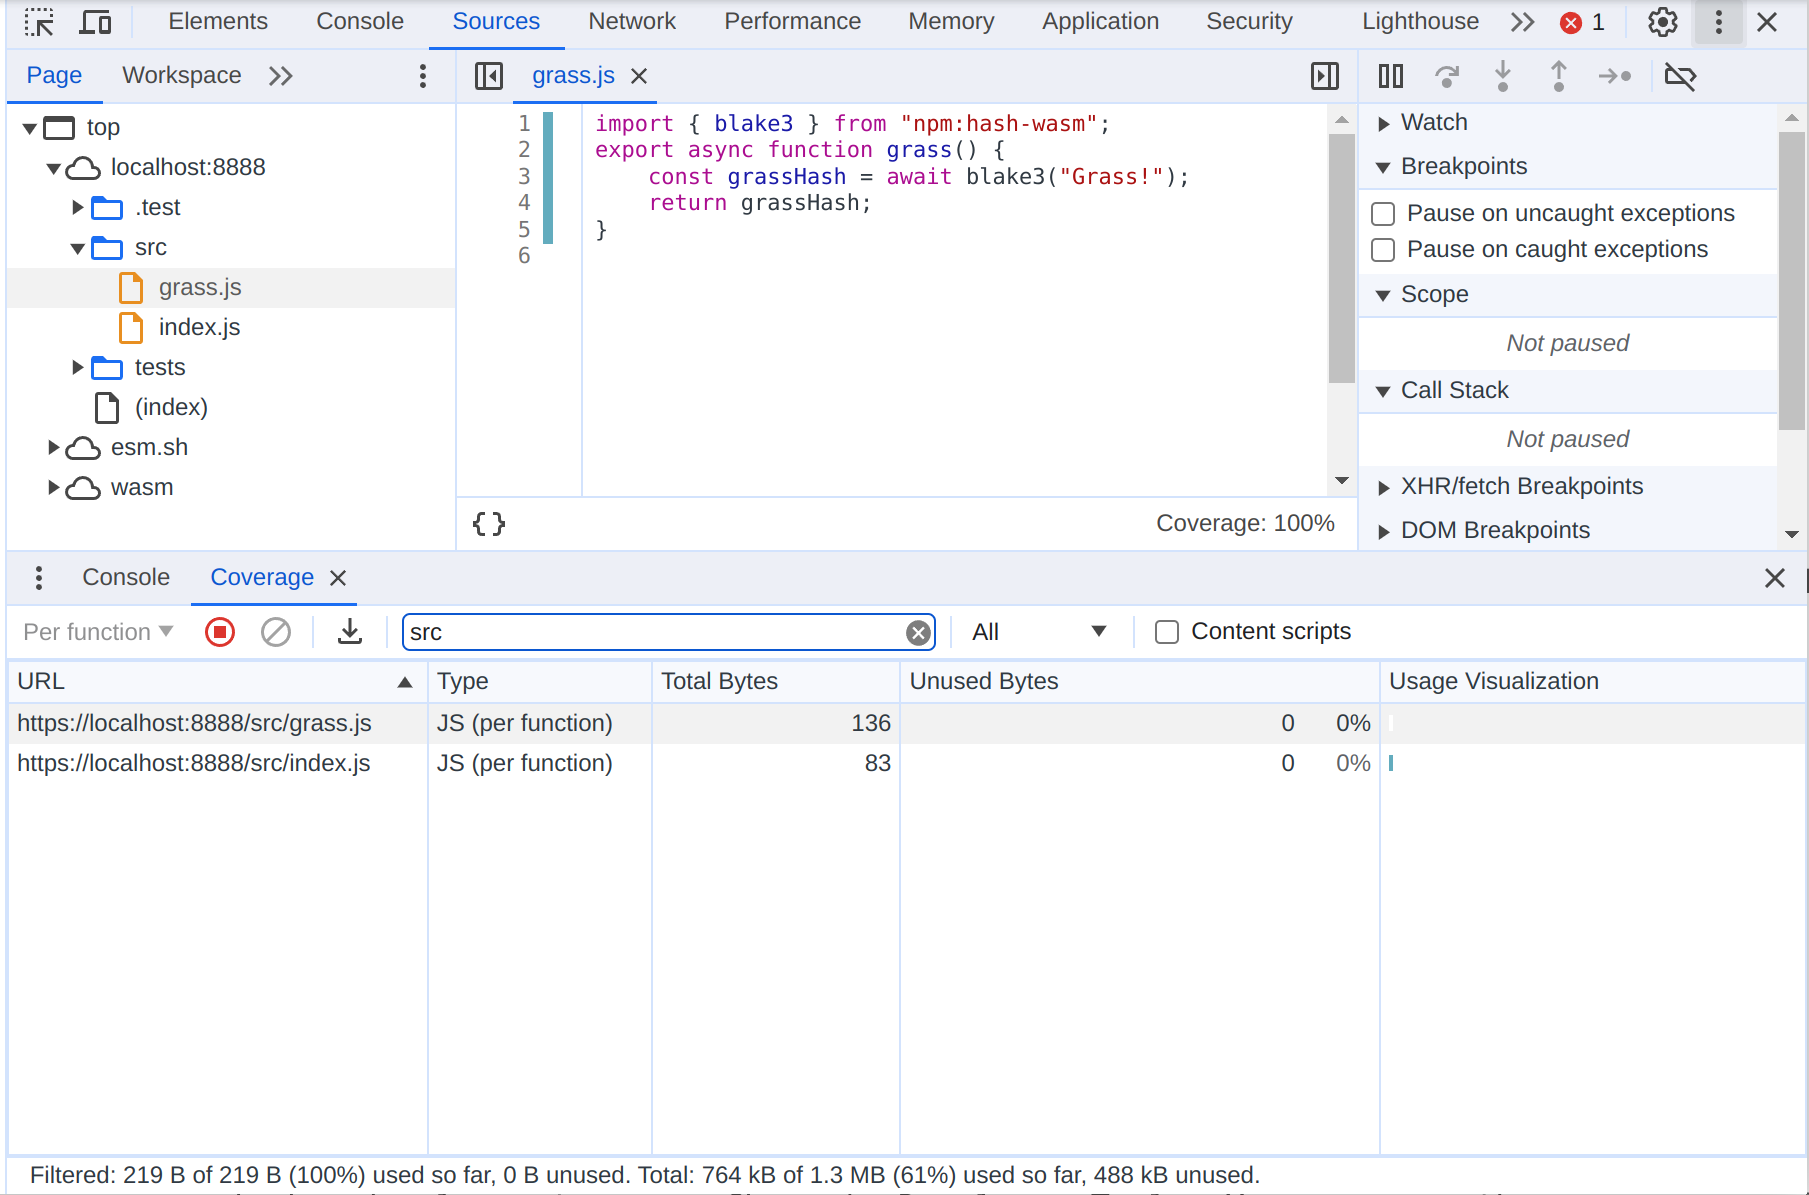
You don’t need node to monitor code coverage in your JS projects.
The hard part is Continuous Integration for both the tests and coverage #
Continuous Integration is, for many, what defines modern software development. It’s not something I’m willing to give up just for convenience’s sake.
Equally important is the ability to have CI automatically check code coverage and fail the test run if coverage doesn’t reach a predetermined threshold. It doesn’t even have to be 100% – just a threshold that makes sense for your project.
This really can’t be done without node. Deno’s node compatibility doesn’t support Playwright yet (which is what I prefer for browser automation for testing).
So, what’s the point of this all if, in the end, you have to use node anyway?
The point is that you and none of the developers working on the project will need to have node on their work machines. The node aspects of the project are run entirely in a GitHub action container using a single OS, a small number of pinned dependencies, and a completely controlled environment. The complexity of managing a node setup and dependencies is shifted entirely into a GitHub action.
playwright.config.js file sets Playwright up to run the browser automation scripts in Firefox, Chrome, and a GTK-based WebKit (which isn’t Safari but is as close as we’re going to get under these circumstances). It’s configured to launch the server that serves up the HTML test file.
To make coverage work we need a Playwright fixture that gives you the Page object you use to interact with the current page but with Chrome’s coverage features enabled and which saves the coverage report to a file in a format that c8, the coverage reporter, understands. You can find that fixture in a file at ci/pageWithCoverage.js. It saves the coverage JSON files to coverage/tmp which is where c8 expects to find it by default.
The ci/tests/mocha.spec.js file contains the actual test run. It waits until the mocha.run callback has been fired and fails the test if there are any failures.
Finally, the GitHub Action workflow file will call the coverage script which runs c8. That shell script looks something like this.
npx c8 report --100You can set the coverage threshold to something lower than --100, but in that case it needs to be set individually for each check. For example: npx c8 report --check-coverage --lines 90 --functions 90 --branches 90 --statements 90.
Now you have a continuous integration that both runs your mocha tests and checks code coverage, all without having to install or use node for local development. This leaves you free to focus on managing the core setup for your project, whether that’s in PHP, Ruby, Python, or a trendier language like Go or Rust.
There is much to be excited about in modern web development #
Built-in code coverage is one of the two features of modern browsers that have the potential to transform web development.
The other, which I think is the most useful aspect of this workflow, is Import Maps.
Import maps are amazing. They:
- Let you load esm-compatible npm modules using bare specifiers, with version ranges, using
esm.sh. (esm.shis also amazing in its own right.) - Alias dependencies. For example, if you need to reuse a module in a Worker but need to swap out a dependency for a Worker-compatible one, import maps make that easy.
- Monkey-patching. You can transparently wrap and monkey-patch a dependency without the importing module ever being aware of it.
- Make mocking or test doubles (relatively) trivial to set up.
- Let you transparently swap a live import with a vendored dependency you maintain locally without the importing module seeing a difference.
And if you need to bundle your code for deployment, you can set up esbuild with a plugin that reads import maps and generate your bundle much like you’re used to. (I have a deno script set up to do this in the raggedy-dev-setup repository, if you need a starting point.)
Personally, I’m most excited about using import maps for testing as they make many testing practices quite a bit less involved because you can now get it all done using a feature that’s standard across all major web browsers, mobile and desktop.
That’s why I’ve been working on a web course for test-driven buildless web development using mocha, browsers, and import maps. If you find the above useful, the course will have much more:
- Step-by-step guides for setting up your test server and test setup.
- Pointers on how to handle special cases that might complicate testing, such as workers, service workers, or components.
- An introduction to mocks and test doubles.
- Practical – no zealotry – advice on unit tests versus integrated tests. (It’s “test-driven development”, people, you’re allowed to write an integrated test if it works better for you.)
- Pointers on how to handle production deploys. (That isn’t the point of the course but I think pointing people in the right direction is probably necessary.)
If any of this sounds interesting, I’ve set up a landing page where you can sign up to be notified when the course becomes available as well as whatever associated freebies I might have lined up.